
Author: Ashik Idrisy, PhD
Edited by: Daniel Krueger, Jake Robinson
As the college football season winds down, you are probably starting, or have already begun, to think about renewals. Who will renew? How do we know? What can we do about it? These are just some of the questions you might be grappling with as you head into next season and as we all face the tailwinds of lower attendance[1] [2]and a decreasing season ticket holder base[3], [4], [5], [6].
This guide will walk you through the creation of a predictive model that will help you answer these questions. While this guide is focused on football season ticket renewals, the methods presented here can be applied to any sport. The only limitation would be sports with less than 25 season ticket holders. As a general rule of thumb, it is hard to create any model with less than 25 data points. This guide will mention various types of data that you can use to create your model so don’t worry if you only have ticket transaction data or only demographic data. As long as you have something, and you have a few years of consistent data you can create a robust model.
There are some things I won’t get into here because it would make the guide too technical, too long, and possibly too boring for most. I won’t show you the code to run a model, or the software you would use to run that code, or the mathematics underlying the models. I’m also not going to get into how to pull the data from your database(s) or who in your organization should lead this effort, these decisions are better left to you.
Here is a quick diagram explaining the steps of creating the renewal model I will go through in this guide:
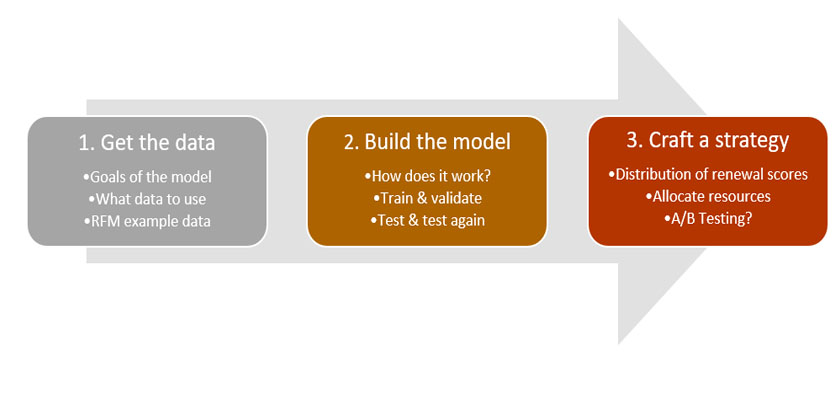
1. Get the data
1.1 – Where to start?
The first thing to decide before getting your hands on any data is what your goals are with the model. Some of the goals have already been discussed above. I am now referring to a very specific goal: are you trying to create a model that is predictive or one that can be acted upon? The two are not mutually exclusive and I will discuss later how to create a strategy from a model regardless of your answer to this question. I am making this distinction because some data lead to a more predictive model, i.e. the model is better at guessing which season ticket holder will renew vs which will not. Whereas, some data can be acted upon during the season to affect the decision to renew or not.
It seems like making this choice is silly. Why not simply have a model with both sets of data and get both a predictive and actionable model? There are two main reasons for not doing this, for one, using too many variables can lead to overfitting. This is when your model seems good on paper but when you give it new data it’s never “seen”, its predictive ability plummets. The second reason is ease of use, it is far easier to explain and work with a model with a handful of variables rather than hundreds of variables. Less is more, in my opinion.
An example should help, take the variable of distance. This variable is typically good for predicting a customer’s likelihood to renew, however it certainly can’t be acted upon. If your model tells you that people living within 50 miles are 25% more likely to renew than those living within 100 miles, that is nice to know, but you can’t exactly make your fans move. However, take the variable of average satisfaction on game day (collected from a survey). Your model might end up telling you that a customer with an average rating over 5 (out of a 10-point scale) are 10% more likely to renew than those with an average score below 5. You can do something about this during the season. You might pay this fan a seat visit or call and email them directly to see what you can do to bring up their game day satisfaction, thereby increasing their likelihood to renew.
In my experience your model is either going to be more predictive or more actionable. Given the data you have access to, your decision might be made for you. Perhaps you have access to more predictive data or more actionable data[7]. This is not to say you need to choose. If you really can’t decide, I suggest you make two different models and then interpret the results in a holistic way. Because no prediction is perfect, one model might say account XYZ is very likely to renew whereas the other might say account XYZ is very un-likely to renew. It will be up to you, knowing what you put into the models and how to read their output to decide how to reconcile these contradictory outputs.
1.2 – What data points/variables/parameters/features to use?
That was a lot of talk about what to think about, but now let’s talk about what to do. I’m going to assume for the rest of this discussion that you have chosen to make the more predictive model, but not too much of the discussion will change if you didn’t. I will also use the term data points, data variables, data parameters, and data features interchangeably.
The first model I made in collegiate athletics was one to predict football season ticket holder renewals and it had the following variables:
- Lifetime ticket purchases & donations
- Football ticket purchases in the past year
- Attendance at Football games in the past year
- Total number of other sports where they are Season Ticket Holders
- Age
- Inferred Gender
- Alumni or not
- Distance to venue
- Median household income
- Are they a new season ticket holder?
- What kind of parking did they have?
- How much did they pay for parking?
- Total years as season ticket holder
This model had a 77% accuracy rate[8] which was a good first step, and certainly better than a coin flip. Which is what you should do if you have no model or a bad model. Indeed, creating a bad model would mean an accuracy of less than 50% and you really would be better off flipping a coin.
If you don’t have all or any of these variables listed above, don’t worry about it as they are merely illustrative. In fact, you might have more data than you think. That is, you can take what data you have and massage it into a new variable or feature, this is sometimes referred to as “feature engineering”, in the machine learning world. For example: you might be able to use graduation dates from an alumni database to get an age range, or you might be able to get distance from the venue from their zip code, or use zip code and census data to get an estimate of their household income, or use the customer’s first name and build a smaller model to infer gender and then use that information in your renewal model. Use this time to get creative.
1.3 – An oldie, but a goodie: RFM data
As a concrete example of the data you can use to create your model, you can try a simple but effective RFM (recency, frequency, and monetary value) data set. Models using RFM data have been used in the retail and telecom industries for many, many years and they have stood the test of time. In the retail space, these variables are defined as follows. Recency: when was the last time the customer visited your store. Frequency: the number of times the customer showed up at your store (over the year, month, week, etc.). Monetary Value: the total amount spent by the customer at your store (over the year, month, week, etc.). Even with these “standard” definitions there is plenty of room left to figure out exactly how best to set the meanings of these variables. You can figure out your own definitions, don’t worry too much about that now, just pick ones that make sense and run the data through the model, and as you test your model you can and should tweak your definitions as needed.
The second model I created to predict renewals was created using this type of data and it had an accuracy rate around 83%. I thought this was quite the improvement from the model with 77% accuracy, not just because of the 6% boost, but also because it only required three variables instead of 21. Less is more!
1.4 – How to prep the data?
Once you get a handle on your data features, you need to create your data table. Start by adding your season ticket holder account IDs on the leftmost column, and then fill the columns to the right for whatever variables you selected. Once you have this, you need to add one more column all the way on the right that labels whether someone renewed their tickets the year before. That is, if you are trying to predict renewals for the 2020 football season this last column will show whether your season ticket holder for 2018 renewed their tickets in 2019. This column can contain “Yes” or “No” values or ‘1’, ‘0’, this might depend on the software you are using to run the model.
I personally like to create an extra dataset to further test my model. If I were creating a model for the first time to predict renewals for going into the 2020 season. I would create a dataset going back to 2017, and then look at who renewed in 2018. I would use the 2017-2018 data in the training, validation steps mentioned below, and I would then use the 2018-2019 data to test my model again.
The last step is to sample your data so that it’s made up of 50% renewals and 50% non-renewals. You might be thinking wait…that makes no sense. We renew way higher than 50%, why would I feed my model data that only shows us renewing at 50%. You’d be right. What I am suggesting is technically a mistake, and it introduces a bias into the model. But this method works, and more importantly I would argue that you are NOT trying to predict your overall renewal rate, which might very well be 99%, but you are trying to predict whether an individual account holder will renew and this a binary 50-50 choice and having data that reflects that actual decision is not wrong.
2. Build the model
At this point you should have your data set ready to go to feed into a model. What exactly is this model? The model is just a mathematical function that will take your input data and spit out a prediction for the likelihood that someone is going to renew. How will this magical function ‘know’, based on the data, what accounts are more likely to renew than others? Well, this is why you attached that column of ‘Yes, No’ for every account in addition to the other data. The model will use this column to figure out which of the variables are better at predicting who will renew and who won’t, because you’ve already told the model. This is why you always hear the phrase in data science of “garbage in, garbage out”. Feed your model bad data and it will spit out bad predictions. Your model doesn’t know anything! You need to give it the right information[9].
Now that we know what the model does with your data, I still haven’t answered what math function you need to use. It can be anything[10], here are some common ones: linear regression, logistic regression, decision trees, random forests, neural nets. Most people refer to the functions as the types of models they are building and that’s fine. I just like to remind myself that the model itself is not too important, first you should focus on the data and let that inform your decision about which function to use. The function doesn’t get selected first! For the RFM data set described above, a logistic regression will work. In fact, I’ve observed that for the RFM data the simple logistic regression model typically does better on new data. That is, a model based on decision trees might give you a better accuracy on paper, but when you apply it to brand new data the accuracy drops quite a bit.
2.1 – Train & Validate
At this point you have the complete data set and the model picked out, you are ready for the next step. Go back to the dataset and split it into three unequal parts[11]. One part is the training set, which should be 70% of your complete data, another is the validation set, this should be 20% of your complete data, and the final part should be the remaining 10% of the complete data, this is called the test set. These percentages are not set in stone and you can relax them as needed depending on the size of the data. I personally use an 80/10/10 split, because I have a separate test data set, as I mentioned above, I make an extra year’s worth of data and test the model on data it’s never “seen” before.
Just to reiterate, if you had a data set that was 1000 rows, you should now have three datasets, one that is the training set with 700 rows, one that is the validation set with 200 rows and one that is the test set with 100 rows. Now let’s discuss how these different data sets are used and it should become clear why you had to make them at all.
First, take the training data set and feed it into your model. This step will teach your model, which variables are more important in determining renewal likelihood. Next, take this trained model and feed it your validation data set and check the outputs for predicted renewal against the true renewals, which you know. If the predictions are “wrong”, or more “wrong” than you’d like, you need to clean up your data AND/OR pick different variables. You might also want to try a different model (function) but this typically won’t help as much as the first two. What dictates how “wrong” the model is, could honestly be its own discussion.
For the purposes here, I will refer simply to the overall model accuracy, which is determined by adding up all the correct predictions and dividing that by the number of total predictions you asked the model to make. Correct predictions are both the ones where someone renewed and the model said they would, and the predictions where someone did NOT renew, and the models said they wouldn’t. From the 1000-row example above, you use you 200-row validation set to get a measure of this accuracy. For instance, if your model predicted 170 of these rows correctly, that is, it labeled non-renewals as and non-renewals, and renewals as renewals then your model’s accuracy is 85%. Well done!
If you are using R, or Python, to run these models, there will be functions built in to calculate this accuracy along with other measures of the performance for your model. Therefore, you don’t have to calculate this accuracy by hand but that might be helpful if you have a small enough data set (less than 10,000) and it’s your first time doing this work. You can certainly run a Logistic Regression model in Excel, but might have to download some add-ins.
2.2 – Test & then test again
If you are satisfied with accuracy of your model based on your validation set, you can now push your test data set into the model. You can use the same formula as we discussed above to calculate the accuracy for the test set. This is what I think of as the theoretical accuracy of the model, as this test set isn’t something your model has analyzed BUT it’s still coming from an overall data set you used to build the model.
In my opinion the true test is to use data the model’s has never seen before. This is why I recommended getting any extra year’s worth of data ready. This is the last step of my modeling methodology; I take the same model I’ve validated, tested and tested it again on this final data set. Then I calculate the accuracy for this new complete dataset. To me this is the true accuracy of the model.
3. Craft a strategy
If you’re still reading and you’ve followed all the steps, you’ve done a lot of work. Congratulations. You might be wondering what happens now. You collected the data, cleaned it, analyzed it, fed it into a model, validated, tested, and re-tested the model, so now what? Now comes the good part. Now you can put your hard work into action and create a strategic plan for using your model’s output. The strategy should ultimately depend on what resources you have available, but I will provide an example of how I’ve used the outputs of these renewal models.
First things first, look at the distribution of scores. The best way to do this is to take your scores and bin them into integers, from 1 to 10. The distribution might possibly look like this:
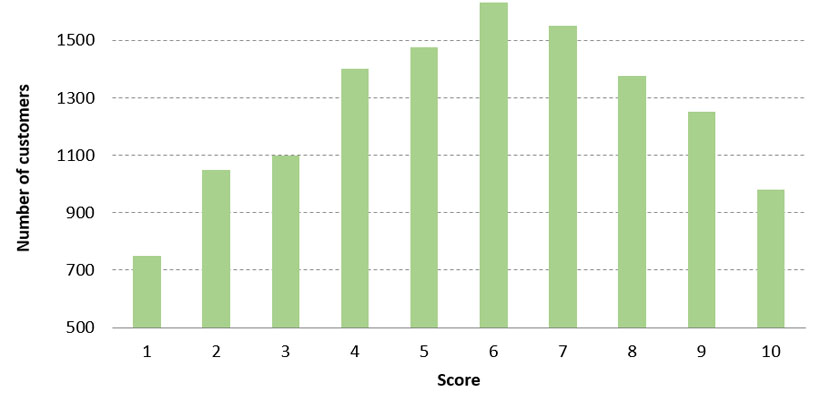
What does this graph mean? It’s hard to make general statements above every score, but what you can do is group the scores into three customer segments: low scores (1 to 3), middle scores (4 to 7), and high scores (8 to 10). Here is one way think about these segments: The low-scorers are the “1st time customers” and they are the most unlikely to renew, the middle scorers are “fence-sitters”, who may renew and who may not, and finally the high scorers are the “loyal fans” who are most likely to renew. Given the distribution above you see that most of the efforts will be spent on fence-sitters as that is your largest group. Depending on resources it might be worth-while to drill down and create smaller segments for this group. You can use these smaller groups to conduct A/B testing of what touchpoint methods work the best and then next year you will have more information about the best way to employ your model. Here is the basic outline of a strategy you can employ with this distribution:
| Strategy | |||
| Group | Digital Ads | Email solicitations | Call |
| Low | ✔ | ✔ | |
| Medium | ✔ | after High leads called | |
| High | ✔ | ✔ | |
What this means is the high scoring group should get phone calls and email solicitations to get them to renew. This is the group most likely to renew, so get them out of the way and done. Next, target the medium scorers with phone calls and emails. All the while this is happening the lowest scoring group should be getting Digital Ads to retarget them to open their emails, or to call in about their season tickets. If they start the conversation on their own it will be much more likely that they end up renewing. If you have more time or resources you can call every single season ticket holder, and you can make sure to do extra personalized efforts. For example, perhaps you look through the survey responses of the low scoring people and create an outbound phone campaign to reach out to these people and see if it’s possible to resolve their issue. This last idea is really resource intensive and would only really work if you have a dedicated outbound sales team.
There is a good chance you are going to have distribution that is different from the idealized situation above and instead might look something like this:
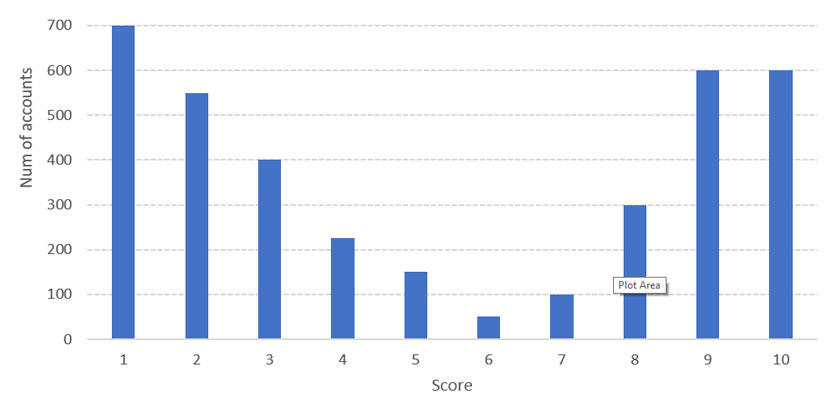
In this case, your model is basically saying that there are many accounts that are likely to renew, and there are many that are not, and there is basically a small number of fence-sitters. Of course, your strategy should reflect this distribution. Remember your model isn’t perfect and it doesn’t have to be, but you need to listen to what it’s saying: more customers feel strongly about not renewing OR renewing. But not that many are un-decided. In this case, I run the strategy above in reverse and start contacting the low scorers first and give them the most amount of attention. The high scores are likely to renew, so just some email reminders, and early renewal incentive should be all it takes. But, don’t make them feel unappreciated, these are your loyal fans (their renewal scores say as much) so take the time to recognize that, perhaps a personal hand-written card will help to show them how much you appreciate them. Again, like above this is a resource intensive suggestion, and only really works if you have the dedicated staffing.
4. Summary
At this point you will have a complete renewal model along with the strategy needed to leverage the model to its full effect. What’s more, you now have a very powerful tool set which will not only help you predict season ticket holders, but many other things: a customer’s propensity to buy tickets, capacity to spend or donate and the list goes on. The steps for these other predictions are essentially all the same. All you’ll need do is get the right data and the rest is mechanics. If you can think it, you can predict it!
4.1 – Here are the “Cliff Notes” version of the guide:
- Create the RFM data set explained in section 1.3
- Make sure you have 3 years of this data
- Use 2 years to train, validate, and test your model
- Use 3rd year to “really” test your model
- Split your data into a train, and validation set, rough split: 70%, 20%
- Keep the other 10% for testing your model output
- Feed your data into a Logistic Regression Model
- Use your validation set to make tweaks to your model
- Once done, use your test set to check the theoretical accuracy of your model
- Finally use your 3rd year of data to get the realistic accuracy of your model
- Create a strategy
- Look at the distribution of scores from your model
- Using this distribution & your current resources: sales team, digital marketing budget, etc. figure out the best way to utilize the scores
- Keep in mind that you will probably do this again next year, so maybe do some A/B testing on your model. For example, giving some customers in each group an extra touch point and see what happens.
If you need help getting any of these steps to work, please feel free to reach out to the data analytics team whose contact information is shown below.
If you’d like to learn about how Learfield IMG College Ticket Solutions can support your team with season ticket retention, analyzing survey response data, creating a lead scoring model, optimizing ticket prices, sales training, or setting up an out-bound sales team, please contact Tyler Reichwein at [email protected]
 |
Ashik Idrisy, PhD
Data Scientist 814-321-7562 Ashik has worked at Learfield Ticket solutions since Sept 2015. During that time, he has created the football renewal models mentioned above, which have been utilized by Penn State, Rutgers and Colorado. Along with these renewal models, Ashik has also developed models to predict attendance, and a customer’s propensity to buy tickets. |
 |
Daniel Krueger
Data Analytics Manager 541-337-9937 Daniel joined Learfield Ticket solutions in Jan. 2019 and developed a renewal model for the University of Oregon, using the same methodology presented in this article. Daniel previously interned with Oregon Athletics where he worked with Ashik to create a model to predict which single game buyers would convert to season ticket holders. |
 |
Jake Robinson
Data Analytics Manager 319-467-0956 Jake joined Learfield Ticket solutions in Feb. 2019 and managed a team of MBA students to develop a renewal model for The University of Iowa’s men’s basketball season ticket holders. In addition to this renewal model, Jake has also created a lead scoring model for football season ticket renewals. |
[1]https://www.washingtonpost.com/news/early-lead/wp/2018/02/13/college-football-attendance-sees-second-largest-decline-in-history/
[2]https://www.cbssports.com/college-football/news/college-football-heads-in-wrong-direction-with-largest-attendance-drop-in-34-years/
[3]http://nevadasportsnet.com/news/reporters/nevadas-season-ticket-base-down-for-sixth-straight-season-falls-82-percent
[4] https://www.buckeyextra.com/sports/20190830/season-ticket-sales-are-down-for-ohio-state-football
[5] http://www.startribune.com/how-plunging-ticket-sales-have-changed-gophers-sports/491766811/
[6] https://www.thelantern.com/2019/09/ohio-state-student-football-ticket-sales-down-by-more-than-6500/
[7] Chances are if you have more actionable data, you have plenty of predictive data.
[8] I’ll explain the technical definition for accuracy later, for now just think about in the intuitive sense you already were; as a measure of the quality of your model.
[9] This is of course specific to the supervised learning we are describing here; things are different when dealing with un-supervised learning models.
[10] It can be anything, but certainly some functions are going to be better at fitting certain data than others.
[11] This could have been done earlier, but it might not have made sense as to why you were doing the splitting.